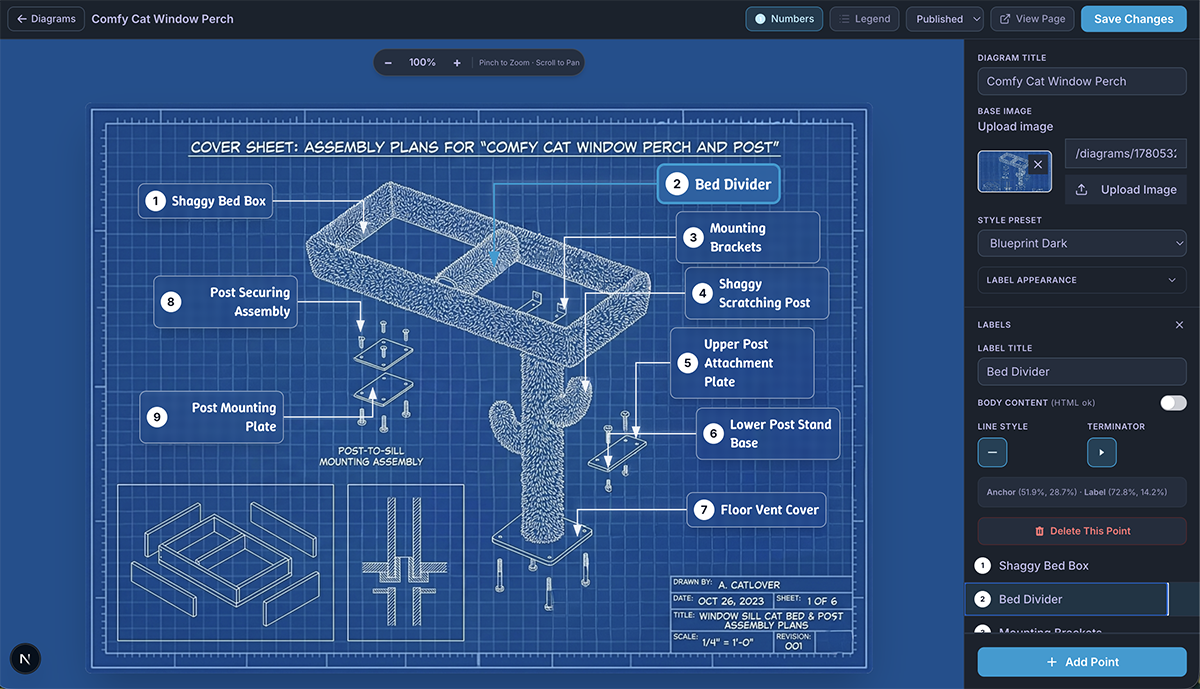
I shipped an **Interactive Diagram Builder** into this portfolio: a WYSIWYG tool for annotating technical artwork with hotspot callouts, leader lines, and a synchronized legend. It is not a flowchart or whiteboard app—it is closer to ThingLink-style interactive images or rich HTML image maps, built for cross-sections, layer breakdowns, and brochure diagrams.
What problem it solves
Static PNGs and PDFs are fine until readers need to explore **which layer is which** or **what a callout refers to** without zooming and squinting. The Diagram Builder stores annotations as structured data on top of a single base image, then renders an interactive viewer on the public site—and optionally inside a blog post. The coordinate system uses **percent positions (0–100%)** for every anchor and label. That means callouts scale with the image across viewports without maintaining separate layouts per breakpoint.
Under the Hood: System Architecture
Data Layer
[
     {
          "anchor": ("x":30, "y":70),
          "label": ("x":13, "y":70),
          "title": "Main Board",
          "content": "<p>Component detail</p>"
     }
]